Acoustics

Introduction to Acoustics

A little knowledge of acoustics — the study of sound — can help you understand some things that you encounter while making music with computers. What does the dB scale on audio meters mean? What does the graph in an equalization effect represent? What are the essential components of tone color? If your medium of expression is sound, you should know something about how sound works and how we perceive it.

This web page introduces you to some basic ideas about sound waves, including their propagation and amplitude. The interactive applications you can download from the syllabus take over from there and cover frequency, pitch, and tone color. There is a lot more to learn about acoustics. We’re just covering some of the basics.

Sound Waves

So what is sound, anyway? When you strike a tuning fork, you hear a clear sound. That’s because striking the object causes it to vibrate in a fairly simple back-and-forth manner, but so quickly that you can’t really see the vibrations. 
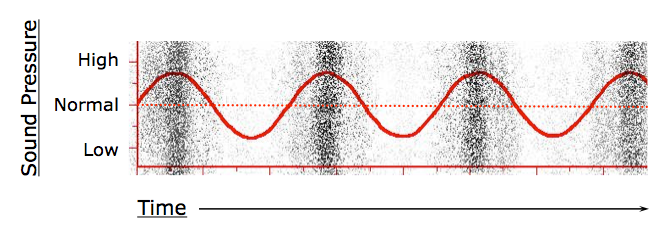
When a tine (prong) of the tuning fork moves away from its resting position and impacts nearby air particles, it causes the particles to scrunch together, creating a more dense area (higher air pressure). This action is called compression. When the tine then moves back past its resting position, the air particles relax and spread out, creating a region of air less dense (lower air pressure) than it was before you struck the fork. This is called rarefaction. As the tine continues to move back and forth, this causes a chain reaction, resulting in areas of higher and lower air pressure propagating away from the tuning fork as a sound pressure wave.

Imagine that you have a cylinder with a piston at one end — rather like the cylinder in a car engine. The piston moves back and forth, alternately compressing and rarefying the air. If you were able to see the individual particles of air, you would see higher pressure regions moving away from the piston, as in the animation below.

Animation showing compression and rarefaction of particles in air as a piston moves repeatedly from to right in a chamber

Animation adapted from Sound Waves, Institute of Sound and
Vibration Research (ISVR), University of Southampton, UK

The piston is the large red object at the left; the tiny black dots are air particles. The darker areas among the particles are more dense — have higher pressure — than the surrounding air. The three red dots mark individual air particles. This shows that the air particles themselves do not move very far as the wave passes through. Instead, they bob back and forth, rather like a styrofoam cup thrown into gentle waves in the ocean. (Don’t try this at the beach!) It’s the pressure chain reaction — the acoustic energy of the wave — that moves from one end of the cylinder to the other.

In free air, a sound wave doesn’t just move in one direction. It propagates in all directions. The picture below shows what might happen to the surrounding air if you were to ring a bell, assuming that there aren’t objects around that partially block the propagation of the sound wave.

Two-dimensional sound wave propagation from a bell sound source.

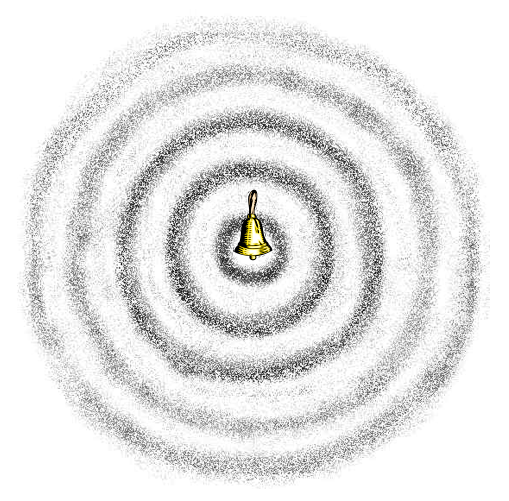
This is not a complete picture, though, because sound waves propagate in three dimensions, not two — in a sphere, with the sound source (the bell) in the center. The picture does indicate that the difference in pressure between the compressed and rarefied regions of air is more extreme closer to the sound source. Sound waves lose energy due to air friction the further away they propagate from the source.

The Speed of Sound

How fast does the sound pressure wave travel? Strangely, it travels the same speed no matter how hard you hit the tuning fork or how quickly the piston moves back and forth. The speed of sound in air is a constant 1130 feet per second. (This varies a bit depending on air temperature and humidity.) Sound waves in air are slower than many other kinds of wave — light waves are nearly 900,000 times faster.

The slow speed of sound is the reason echoes are so prominent in a stadium. If you shout, it will take about a half second for the sound to travel 500 feet, bounce off of a concrete wall, and another half second to travel back to you. You will hear your echo one second later than you shouted.

Sound Wave Plots

How does the piston example above relate to something we care about while working on music in software? It is the basis for the most common representation of sound waves: the time-domain waveform plot. This is a graph showing air pressure changes over time.

Time-domain waveform plot superimposed on a freeze frame from the compression/rarefaction animation above

This picture makes clear how the compressions and rarefactions of sound waves turn into the graph with the wiggly line that we’re all so familiar with. The higher the line goes on the Y axis, the greater the air pressure.

Amplitude and Decibels

The extent of the change in air pressure of a sound wave from the normal equilibrium pressure is called amplitude. If there is a large difference in pressure between compressed and rarefied regions of air supporting a given wave, then that wave is said to have a high amplitude. Sound level meters in audio programs often are capable of reporting two types of amplitude measurement: peak and average. Both types are determined by looking at very brief segments of sound (often called ‘windows’). When a waveform plot is swinging up and down dramatically, then the wave has high average amplitude. Greater average amplitude is associated loosely with sounds that seem louder to us than ones whose waves have lesser average amplitude, though perceived loudness also depends on other characteristics of sound.

Amplitude is usually measured in decibels (dB), a logarithmic scale that compares the amplitudes of two sound waves to each other, or the amplitude of one sound wave to a reference level. A doubling of amplitude represents a difference of about 6 dB. So if you took a waveform and scaled it by 0.5, so that it then had half the amplitude, you would be reducing its amplitude by 6 dB. Scale this second waveform by 0.5, and you create a difference of 12 dB between it and the original waveform.

When you watch a meter in a software mixer, you’re seeing the comparison of a sound wave with a reference level that is the maximum level the system can handle. The numbers printed in dB show 0 as this maximum level, and levels below this are shown as negative decibels: -6 dB, -12 dB, -18 dB, and so on. The minimum level is sometimes labeled as negative infinity (-), which is silence.

We use the logarithmic decibel scale for two reasons:

  1. it lets us represent the very wide range of air pressures we’re exposed to, using a manageable scale that rarely encompasses differences greater than 120 dB, and
  2. our ears respond to sound pressure amplitude in a way that is roughly logarithmic. That is, each doubling of amplitude creates a roughly equal change in perceived loudness. Consider the following time-domain plot.

    Compare decibel values of sine waves at three amplitudes (labeled A, B, and C)

    The difference in perceived loudness between waveforms A and B is the same as the difference in loudness between B and C. This is true even though the change in amplitude units (shown with horizontal dashed lines) is different between the two pairs: B is one amplitude unit greater than A, while C is two amplitude units greater than B.

Sound Pressure Level

Sometimes we see sounds described as having a sound pressure level, or SPL, labeled in decibels. This means that the reference level used for computing decibel values is something called the threshold of hearing, an empirically determined standard that is the softest tone, of a certain pitch, that an average human with excellent hearing can perceive. If that is 0 dB, then louder sounds have higher dB values.

A fine point: SPL actually is measured in terms of the intensity of a sound, which refers to the power of the changes in air pressure as they contact a surface, like your ear. Intensity is measured in watts per square meter.

The following table gives you a sense of the very wide variety of acoustic experiences that span the range from 0 to 130 dB SPL.

Relative Intensity of Familiar Sounds
dB SPL Intensity (watts/m2) Example sound source
130 10 Threshold of pain
120 1 Jet taking off 500 feet away
110 .1 Medium-loud rock concert
100 .01 Power saw
90 .001 New York subway
80 .0001 Heavy traffic on freeway
70 .00001 Vacuum cleaner 10 feet away
60 .000001 Normal conversation
50 .0000001 Light traffic 100 feet away
40 .00000001 Hushed conversation
30 .000000001 Whisper 5 feet away
20 .0000000001 Quiet living room (no TV)
10 .00000000001 Breathing
0 .000000000001 Threshold of hearing

Hearing Damage

We can also use the concept of SPL to decide how long it’s safe to listen to loud sounds. Consider the table below, which uses US Government standards to guide us in determining when hearing damage might occur.

US Occupational Safety and Health Administration Standards
Max duration SPL Example sound source *
0.25 hours 115 dBA Loudest parts of a rock concert
0.5 110
1 105 Roommate screaming at close range
1.5 102
2 100 Very loud orchestra
3 97
4 95 Subway train
6.1 92
8 90 Lounge duo

Adapted from OSHA Employee Noise Exposure table
* Example sources from table on p. 3 of Mackie HR624 manual.

The impact of excessive noise exposure in urban environments on health is receiving more attention than it used to (e.g., the Pilot Survey of Subway and Bus Stop Noise Levels).

If you think about the first entry in the table, it should make you wonder about concert experiences you’ve had. If you want to continue enjoying music as you age, it would be a good idea to invest in some ear plugs. Some of them do not muffle the brightness of sound, for example, the Alpine Hearing MusicSafe Classic and Etymotic High Fidelity earplugs. Cheap insurance.

Perhaps even more important in our daily lives: where do you think earbuds used with portable music players should go on this table?

For more information about hearing damage, visit the FAQ at the Dangerous Decibels site. The “Jolene” mannequin described elsewhere on that site is providing insight into the question of sound levels produced by portable music players.